EU: CROATIA IN SECOND PLACE FOR OBESITY

By: Servet Yanatma
Photo: J. Z./Euronews
Obesity poses an increasing challenge in Europe with one in six EU citizens classed as obese, and over half of adults in the EU overweight. The data shows one in six Europeans with obese and over 50% of adults overweight. The rates vary from country to country but where is the problem the worst?
Obesity is a serious public health problem as it increases the risk of chronic diseases such as hypertension, diabetes, coronary heart disease, and certain cancers.
On average in the EU, overweight and obesity reduce life expectancy by nearly three years according to the Organisation for Economic Co-operation and Development’s (OECD) ‘Health at a Glance: Europe 2020 : State of Health in the EU Cycle’ report.
Recent estimates also suggest that overweight and obesity cause more than 1.2 million deaths every year across the World Health Organization (WHO) European Region, which comprises 53 countries.
The WHO’s ‘European Regional Obesity Report 2022’ report shows that obesity is the fourth highest cause after high blood pressure, dietary risks, and tobacco, corresponding to more than 13 per cent of total deaths.
The body mass index (BMI) is largely accepted as the most useful measure of obesity for adults (those aged 18 years and over) when only weight and height data are available.
It is a measure of a person’s weight relative to their height.

The table above shows the WHO’s BMI result classification:
- < 18.50: underweight;
- 18.50 – < 25.00: normal range;
- >=25.00: overweight;
- >= 30.00: obese.
The rates of overweight and obese significantly differ in gender, age, and level of education.
So, how do obesity and overweight rates vary across Europe? Which countries have the most obese populations? And what are the reasons behind obesity?
More than half of adults in the EU are overweight
In 2019, 44.8 per cent of adults living in the EU had a normal weight while more than half (52.7 per cent) were overweight, and 2.5 per cent were underweight, as measured by their BMI, according to Eurostat, EU’s official statistical office.
Overweight is categorised into two main groups, namely pre-obese and obese. We will look at them in more detail below.
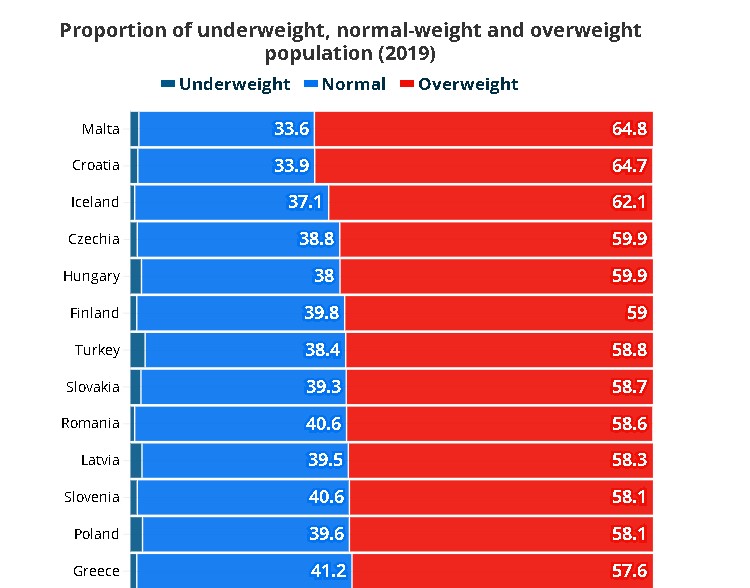
The proportion of overweight people significantly varied across the EU.
Highest share of overweight adults in Croatia and Malta
Croatia and Malta (both 64.8 per cent) had the highest proportion of overweight people in the EU. Almost two out of every three were considered overweight in these countries.
When the European Free Trade Association (EFTA) and two EU candidate countries are included, they were followed by Iceland, Czechia, and Hungary where the overweight rate was 60 per cent or over.
Lowest overweight rates in Italy and France
The lowest proportion of overweight people was recorded in Italy (45.7 per cent), France (47.2 per cent), and Luxembourg (48.4 per cent). These were the only countries with an overweight rate below 50 per cent.

One in six adults in the EU are obese
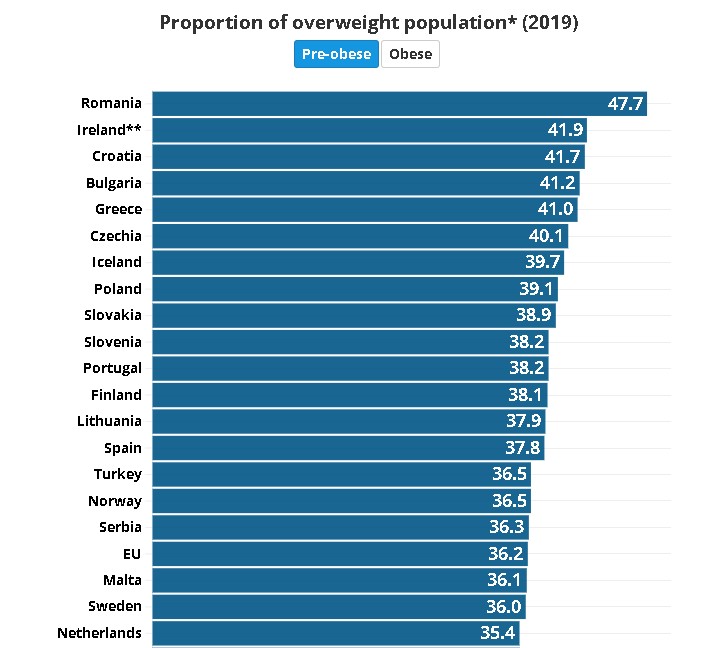
Looking at the details of overweight adults, 16.5 per cent of adults were obese – around one in six – and 36.2 per cent were pre-obese in the EU.
In 2019, the proportion of obese varied from 10.9 per cent in Romania to 28.7 per cent in Malta.
At least one in five adults were obese in 12 of 33 countries across Europe.
Obesity in EU’s ‘Big Four’ and the UK
The obesity rate was 21 per cent in the UK (2017 data). In the EU’s so-called “Big Four” economies, Germany (19 per cent) had the highest obesity rate, followed by Spain (16 per cent), France (15 per cent) and Italy (11.7 per cent).
The prevalence of obesity is on the rise
Over the last two decades, the prevalence of obesity has increased in the EU according to OECD’s ‘Health at a Glance: Europe 2020’ report.
Among the 18 EU countries with data available since around 2000, the average obesity rate increased from 11 per cent in 2000 to 15 per cent in 2008, and 17 per cent in 2018.
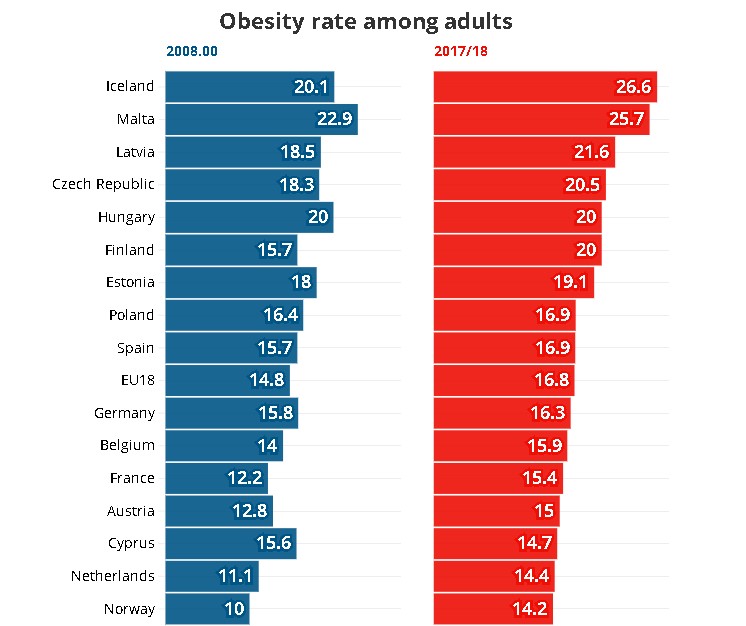
Between 2008 and 2017/18, the obesity rate rose in almost all countries except Cyprus and Hungary.
In this period, four Nordic countries saw the largest increase in the obesity rate. Iceland (6.5 percentage points, or pp) had the highest change, followed by Finland (4.3 pp), Norway (4.2 pp), and Sweden (3.8 pp).
Why do overweight and obesity rates significantly vary?
There is no one simple answer to explain the variance in rates. An article titled ‘Prevalence of adult overweight and obesity in 20 European countries, 2014,’ which appeared in European Journal of Public Health, found that the overall prevalence was higher in Eastern European countries when compared with central and northern countries.
The prevalence of overweight and obesity was related to socioeconomic characteristics. Low socioeconomic status is described as associated with obesity.
“The socioeconomic status may indirectly influence weight status through dietary habits, good access to exercise facilities, health literacy, and physical activity participation,” the article suggested.
Overweight rate was higher in men than women in all countries
Gender is a significant variable in explaining the rates of being overweight. It was higher in men than women among all 33 European countries.
In the EU, 60.2 per cent of men were overweight while this rate was 45.7 per cent in women.
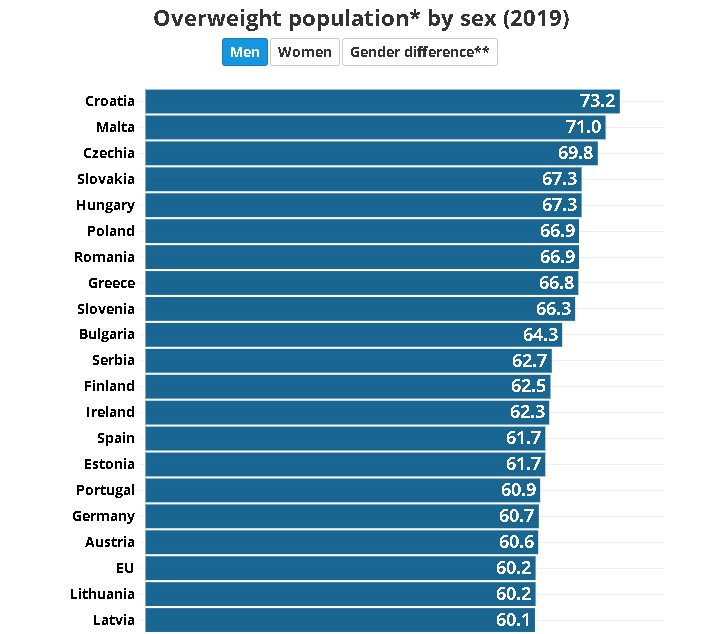
The gender gap significantly differed. The largest difference was recorded in Luxembourg (20.1 pp), followed by Czechia (19.2 pp) and Cyprus (18.6 pp).
However, the gender gap was not considerable in some countries such as Turkey (2 pp) and Latvia (3.2 pp).
Share of obese women was higher than men in several countries
When we look at obesity by gender, we have a different story than the overweight.
In 2019, there was no systematic difference between the sexes as regards the share of obese men and women.
In the EU, the obesity rate was 16.8 per cent in men while it was slightly lower in women (16.3 per cent).
The highest proportion of obese men (30.6 per cent and women (26.7 per cent) was recorded in Malta.
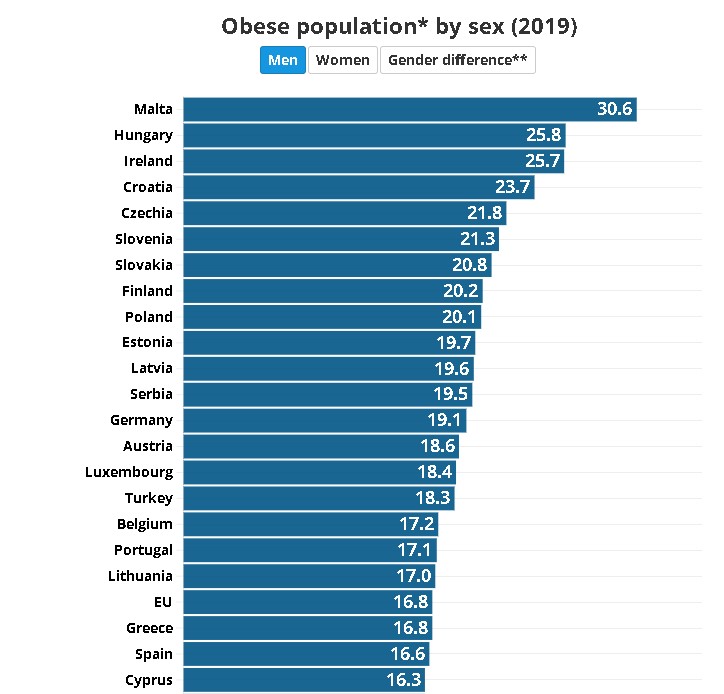
In 11 of 30 countries, the proportion of obese adults was higher in women than men.
These countries included Turkey, Latvia, Estonia, Lithuania, the Netherlands, Finland, France, Portugal, Denmark, Ireland and Sweden.
The states of obese women in Turkey and Latvia are striking, as their shares were substantially higher than men. Thus, the gender difference was significantly high in these countries, respectively 7.8 pp and 6.1 pp.
Proportion of overweight generally increased with age
Except for those aged 75 or over, the older the age group, the higher the share of overweight people in the EU.
The 18 to 24 age group recorded the lowest shares of overweight people (25 per cent), whereas the 65 to 74 group had the highest shares (65.7 per cent).
Similarly, this was also a pattern for the obesity rate (6 per cent vs. 22 per cent).
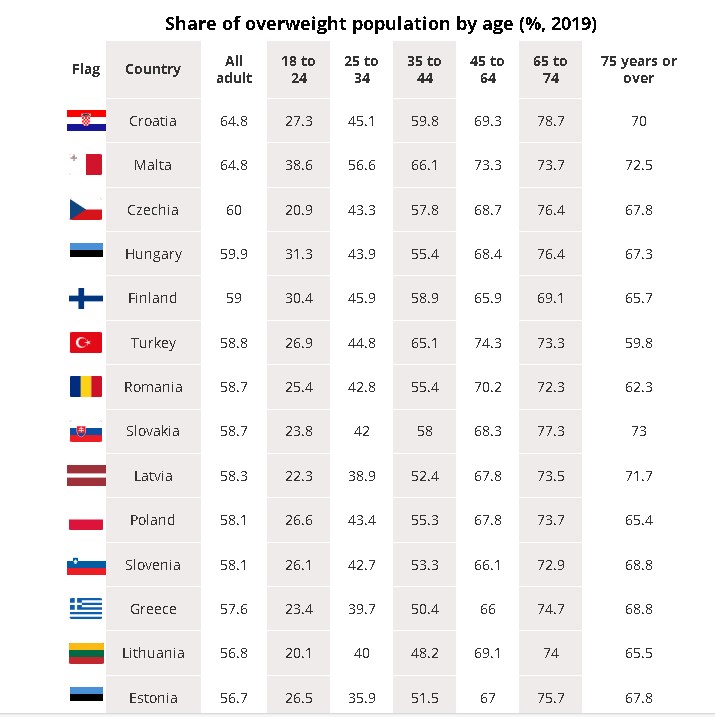
There were a few countries, such as Denmark, Ireland, and Sweden, where the percentage of overweight was highest in the 54 to 64 age group, indicating slight exceptions.
Education level matters in overweight and obese
There was a clear pattern for education level, too. The proportions of overweight and obese people fall as the educational level rises in the EU.
In 2019, the percentage of overweight adults among those with a low education level stood at 59 per cent, while it was 54 per cent for those with a medium education level and 44 per cent for adults with a high education level.
Likewise, 20 per cent of adults with low and 17 per cent with medium to 11 per cent of adults with high education level were obese in the EU.
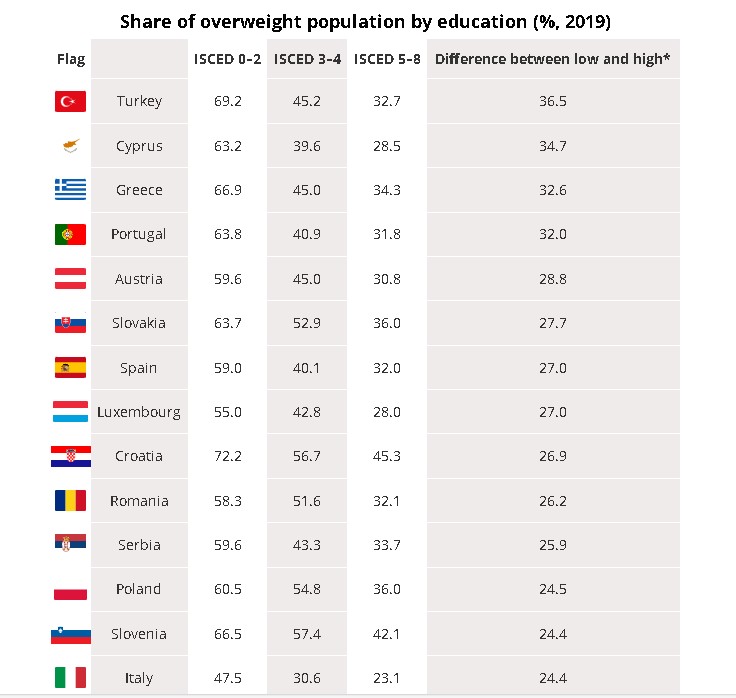
The overweight rate was higher in those with a low education level than a high degree level in all the countries in the table.
The education gap between the low and high levels substantially varies in the overweight population. It ranged from 4.6 pp in Norway to 36.5 in Turkey. This figure was 20.8 pp in the EU.
The WHO warns that this gap also results in further inequality in health and employment outcomes.
Educational level is based upon the International Standard Classification of Education (ISCED) and refers to:
- Low: pre-primary, primary and lower secondary education (ISCED levels 0–2);
- Medium: upper secondary and post-secondary non-tertiary education (ISCED levels 3 and 4);
- High: tertiary education (ISCED levels 5–8).
Causes of obesity and suggestions to halt the rise
The rising prevalence of obesity is driven by several behavioural and environmental factors, according to the OECD report. These include urbanisation, increased sedentary behaviour, and the widespread availability and marketing of energy-dense foods.
“Socially disadvantaged groups are particularly at risk of becoming obese, either because of less healthy nutrition habits or lack of physical activity,” the report also found.
“Obesity is a complex multifactorial disease,” Dr Hans Kluge, WHO Regional Director for Europe, wrote in the report. That means no single intervention alone can halt the rise of the growing obesity epidemic.
You can easily calculate your BMI at NHS’s website and see whether you are overweight.


